LoL Prediction S11 🗡️
League of Legends s11 Ranked Prediction


- Introduction
- The dataset
- Data Cleaning
- Most popular champions
- Linear Regression
- Random Forests
- Best/Worst Composition
- Comparing with S10

Introduction
Riot Games brings massive changes to their game 'League of Legend' every year. This year, they changed their item system, drastically changing their game ecosystem. It has been few months since the big update and now players have fully adapted to the changes. Let's take a look at what happened to the ecosystem and what is the best team composition now.
- Find out what are the most popular champions now.
- Find out which team composition is the best.
- Compare Season 10 and pre-Season 11. How did the item changes impact the game?
The dataset
The data we are going to use is a csv file obtained from scraping op.gg which is a website with League of Legend statistics. If you are interested you can visit here. The dataset consists of 2901 ranked matches from Korea(WWW), North America(NA), Eastern Europe(EUNE), and Western Europe(EUW) servers. It has which team won the match, the total time of the match, blue team composition and red team composition. Note that only the high elo games were added this includes Challenger, Grand Master, Master and sometimes even High Diamonds. Note that there are 153 total unique champions with 'Rell' as the latest addition. Duplicate games have been removed.
import numpy as np
import pandas as pd
import matplotlib.pyplot as plt
from sklearn.linear_model import LinearRegression
from sklearn.model_selection import train_test_split
from sklearn.metrics import r2_score, mean_squared_error
import seaborn as sns
from sklearn.utils import shuffle
%matplotlib inline
df = pd.read_csv ('data/s11.csv')
df = shuffle(df)
df.head()
import re
date_str = df.game_length

for i in range(len(date_str)):
    if type(date_str[i]) == str:
        p = re.compile('\d*')
        min = float(p.findall(date_str[i][:2])[0])
        temp = p.findall(date_str[i][-3:])
        for j in temp:
            if j != '':
                sec = float(j)
                break
        date_str[i] = (60*min+sec)
    else:
        date_str[i] = date_str[i]
#     print(date_str[i])
# print(len(date_str))

# remove timestamp since it does not affect the game
df = df.drop(['timestamp'], axis=1)
df.describe()
Most popular champions
- Camille(Top): 19.68% pick rate
- Graves(Jg): 37.4% pick rate
- Akali/Yone(Mid): 15.89% pick rate combined
- Jhin/Kai'sa(Adc): 39.92% pick rate combined
- Leona(Supp): 25.37% pick rate
Notes:
- The result is very skewed because there are 2271 Red Team win compared to only 630 Blue Team wins
- There are in total 2901 games and more than half of it is from Korean server
no_nulls = set(df.columns[df.isnull().sum()==0])
print(no_nulls)
So there are no null values which is good!
cat_cols = ['result', 'server', 'team_1__004', 'team_2__003', 'team_1__001', 'team_2__005', 'team_1__003', 'team_2__001','team_1__002', 'team_1__005', 'team_2__004', 'team_2__002']

def create_dummy_df(df, cat_cols):
    '''
    INPUT:
    df - pandas dataframe with categorical variables you want to dummy
    cat_cols - list of strings that are associated with names of the categorical columns

    OUTPUT:
    df - new dataframe with following characteristics:
        1. contains all columns that were not specified as categorical
        2. removes all the original columns in cat_cols
        3. dummy columns for each of the categorical columns in cat_cols
        4. Use a prefix of the column name with an underscore (_) for separating
    '''
    for col in cat_cols:
        try:
            df = pd.concat([df.drop(col, axis=1), pd.get_dummies(df[col], prefix=col, prefix_sep='_', drop_first=True)], axis=1)
        except:
            continue
    return df
df = create_dummy_df(df, cat_cols)
max_time = max(df['game_length'])
df=pd.concat([df.drop('game_length', axis=1), (df['game_length']/max_time)], axis=1)
df.head(10)
The data is ready for modelling.
y = df['result_Victory']
X = df.drop(['result_Victory'], axis = 1)

X_train, X_test, y_train, y_test = train_test_split(X, y, test_size = 0.2, random_state=42)

lm_model = LinearRegression(normalize=True)
lm_model.fit(X_train, y_train)
test_pred = lm_model.predict(X_test)
train_pred = lm_model.predict(X_train)
r2_test = r2_score(y_test, test_pred)
r2_train = r2_score(y_train, train_pred)
print("test r2: "+str(r2_test))
print("train r2: "+str(r2_train))
Clearly, linear regression is a poor model for this problem haha. Makes sense since we only have discrete fields except game_length.
def coef_weights(coefficients, X_train):
    '''
    INPUT:
    coefficients - the coefficients of the linear model
    X_train - the training data, so the column names can be used
    OUTPUT:
    coefs_df - a dataframe holding the coefficient, estimate, and abs(estimate)

    Provides a dataframe that can be used to understand the most influential coefficients
    in a linear model by providing the coefficient estimates along with the name of the
    variable attached to the coefficient.
    '''
    coefs_df = pd.DataFrame()
    coefs_df['est_int'] = X_train.columns
    coefs_df['coefs'] = lm_model.coef_
    coefs_df['abs_coefs'] = np.abs(lm_model.coef_)
    coefs_df = coefs_df.sort_values('abs_coefs', ascending=False)
    return coefs_df
coef_df = coef_weights(lm_model.coef_, X_train)
coef_df.head(20)
Recall that 1 = Blue win and 0 = Red win. So positive coefs. here means helpful for the Blue team and negative coefs. means helpful for the Red team. Most of the fields in the top 20 table above, are not something we see often. For example 435-aphelios(top), 689-sion(adc), 248-sona(top) are considered troll. Here are some other findings.
- Looks like every lane is somewhat equally important as their appearance in the table above are similiar
- Most of these are troll picks negatively affecting its own team's winrate
- Picks that are actually helping team's winrate: Sion(ADC), Pantheon(ADC), Yasuo(Sup)??, Ekko(Sup)??
- This table raises more questions than answers!
from sklearn.ensemble import RandomForestClassifier

rnd_clf = RandomForestClassifier(n_estimators=2000, max_leaf_nodes=32, n_jobs=-1)
rnd_clf.fit(X_train, y_train)
y_test_pred = rnd_clf.predict(X_test)
test_acc = np.sum(y_test_pred == y_test)/len(y_test)
print("test accuracy: "+str(test_acc))
Wow we went from 0% to 80% accuracy with random forest!
import shap

explainer = shap.TreeExplainer(rnd_clf)
shap_values = explainer.shap_values(X_test)
shap.summary_plot(shap_values[1], X_test)

Interestingly, West Europe tend to win more as Blue team as games are longer. In contrast, Korea tend to win more as Red Team as games gets longer. So there seem to be a trend difference between regions. Furthermore, in general, the shorter the game, blue team wins more for some reason I cannot figure out.
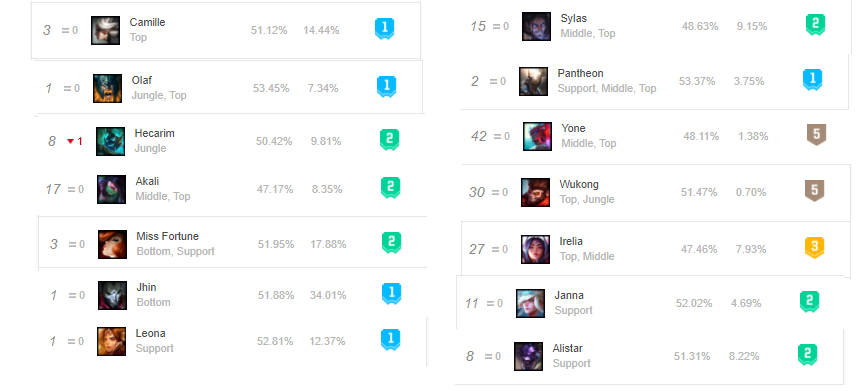
Best/Worst Composition
Best
- (Top)Camille,Yone (Jg)Hecarim,Olaf,Twitch (Mid)Akali (Adc)Miss Fortune,Jhin (Sup)Alistar,Janna,Leona
Worst
- (Top)Pantheon,Irelia (Jg)Wukong (Mid)Sylas,Yone
If we compare this with the official na.op.gg champion rankings, all the best champions listed here are also listed on their website as either tier one or two as well. (Except Twitch and Pantheon).


Comparisons
- The new update caused each roles to impact more evenly to the game's result
- Bottom lane has generally good picks with no worst picks in season 11.
- The new update caused more 'high risk high reward' champions to win more and 'generally good' champions to fall